
Precision Market Analytics Dashboards.
Explore our curated collection of static trading dashboard visualizations. We provide modular layouts designed for high-frequency environments where data clarity determines execution speed.
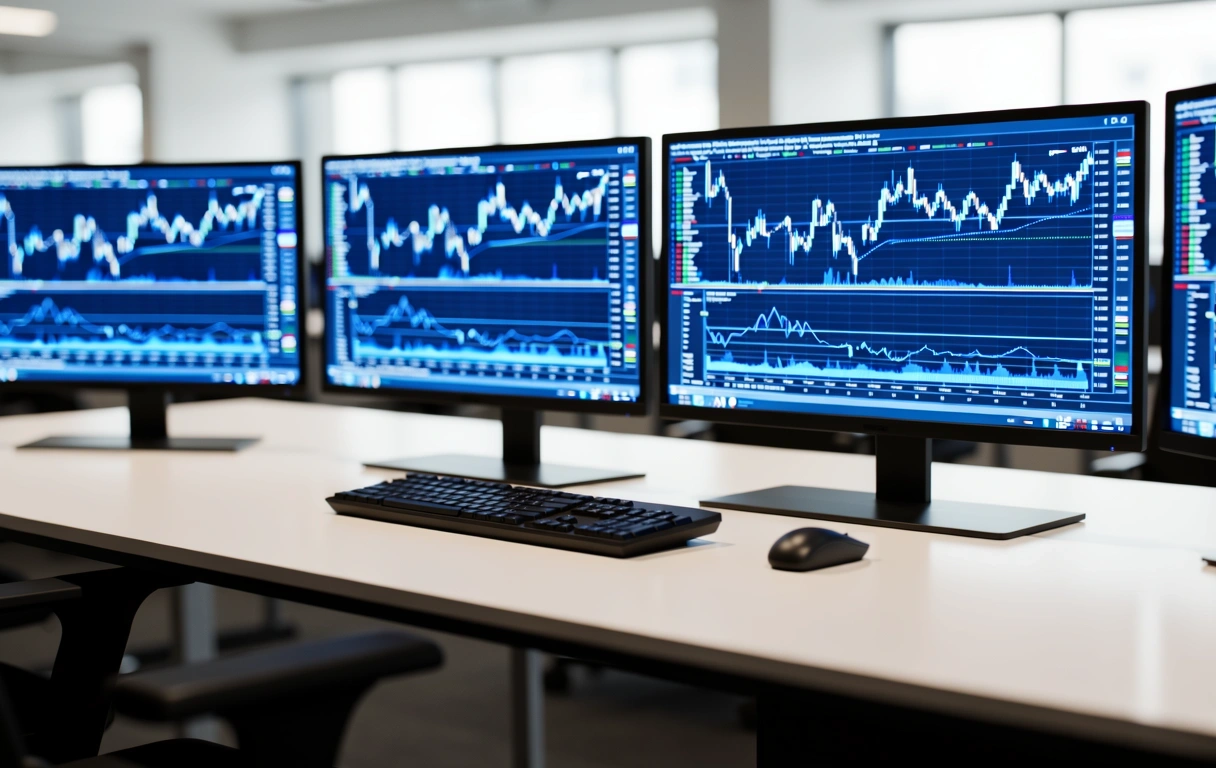
Omnichannel Execution Interface
Our primary market analytics configuration focuses on multi-asset visibility. This layout prioritizes real-time order book depth alongside volatility clusters, allowing traders to monitor correlation across fragmented liquidity pools.
- Integrated Heatmaps: Instant identification of volume spikes and block trade movements.
- */ Scalable Timeframes: Seamless switching between tick charts and daily candle aggregates without losing spatial context.
Standardized Analytical Templates
Each trading dashboard exhibit represents a functional archetype refined through analyst feedback in the Ho Chi Minh City financial hub.
Crypto Liquidity Map
Optimized for digital asset volatility. Features cross-exchange price discovery and whale wallet tracking within a unified market analytics frame.
Global Equity Scanner
A dense data environment for monitoring high-cap stocks. Includes sector heatmap integration and real-time earnings impact visualizations.
Forex Sentiment Hub
Visualizing currency strength metrics and central bank calendar influence. Built for macro-economic analysts requiring global parity views.
The Architecture of
DragonDash Analytics
01 Data Density Calibration
We balance informational depth with cognitive load. Every dashboard element is placed to reduce eye-travel and increase reaction speed during market shifts.
02 Static Verification
Before interactive deployment, our layouts undergo rigorous visual testing. We ensure that market data is readable across varied lighting environments and low-contrast scenarios.
03 Adaptive Scaling
Our modules follow a strict 12-column logic, allowing components to stack perfectly based on the analyst's workstation hardware configuration.

Selecting Your Configuration
Different trading styles require distinct visual priorities. Use our categorization to identify the layout that matches your operational workflow.
| Layout Type | Primary Focus | Update Hub | User Profile |
|---|---|---|---|
| Scalp Terminal | Order Flow / DOM | Millisecond | High Frequency |
| Portfolio Matrix | Asset Allocation | Minute/Daily | Fund Manager |
| Sentinel Alert | Signal Detection | Event-Based | Algorithmic |
| Global Flow | Macro Trends | Hourly | Macro Strategist |
Ready to define your own visual methodology?
Our market analytics experts are available for consultations in Ho Chi Minh City. We assist in mapping complex data requirements to specific dashboard layouts tailored for your firm's unique trading dashboard needs.
Call us: +84 28 1234 1111