Precision Market Analytics for the Modern Trader.
DragonDash provides professional-grade static trading dashboard visualizations designed for analysts who require high-signal data over noise. We transform complex market streams into structured visual intelligence.
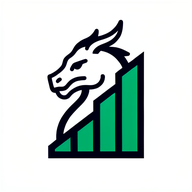
Structural Intelligence
Our approach to the trading dashboard centers on legibility and hierarchy. We remove the clutter typical of retail platforms to focus on institutional-strength data.
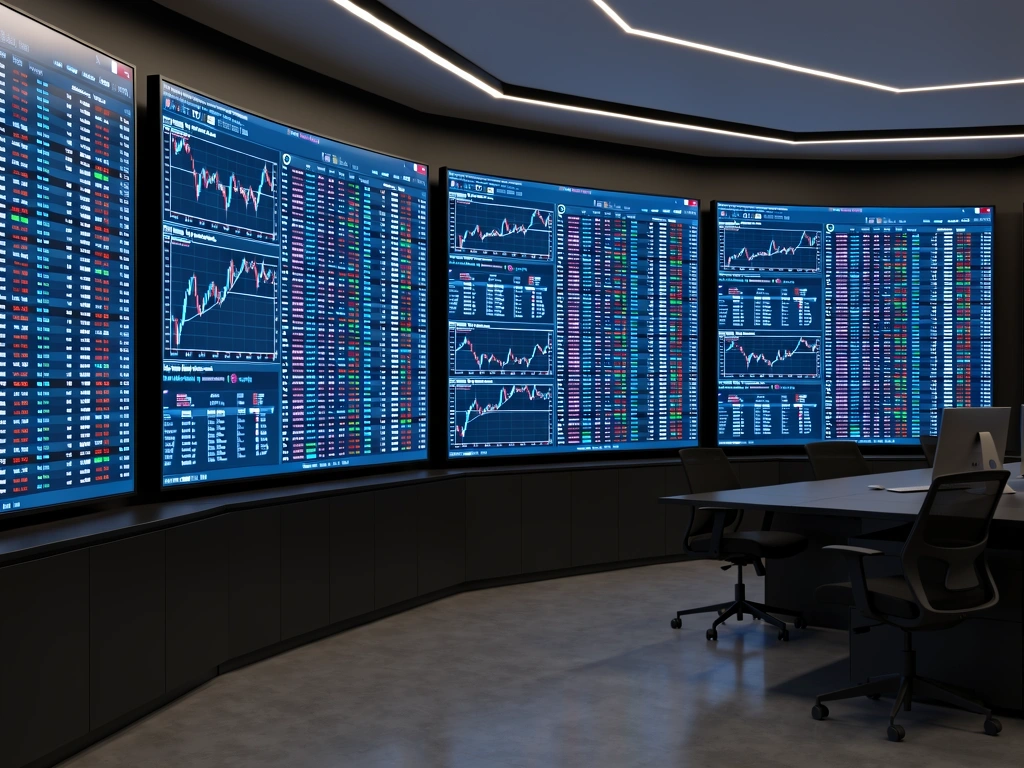
Volatility Heatmaps
Cross-asset correlation and risk distribution.
Our market analytics portal delivers a high-level view of global market stress. By visualizing historical volatility relative to current price action, traders can identify overextended assets before they mean-revert. This is not just data; it is a roadmap for risk management.
Signal Processing
We process millions of data points across equities, FX, and commodities to extract actionable visual patterns.
- Real-time ingest logic
- Statistical noise reduction
- Multi-timeframe synching
Data Integrity
Precision is the foundation of DragonDash. Every dashboard visualization is cross-referenced against multiple liquidity providers to ensure your analysis is based on truth.
Institutional Depth
DragonDash provides the same visual tools used by professional fund managers. Our market analytics go beyond simple price charts to offer deep insights into market microstructure and order flow dynamics.
Visual Velocity
Time is the most valuable resource for any analyst. We focus on "glanceability"—the ability to understand a complex market situation in under three seconds through superior dashboard design.
Static Reliability
Unlike flickering web widgets that crash, our static visualizations are robust, lightweight, and perfectly rendered for reporting and presentation-quality analysis.
Continuous data harvesting across 40+ global exchanges.
Access 10 years of historical data visualizations for periodic backtesting and trend analysis.
Built for Analytical Rigor, Not Casual Browsing.
DragonDash is headquartered in the Ho Chi Minh City Center 1, serving a global community of quantitative analysts and professional traders. We believe that better data leads to better decisions, and better visualization leads to better data.
-
Structured Data Warehousing
Every data point is cleaned, normalized, and verified before visualization.
-
Pattern Recognition Overlays
Automated detection of institutional liquidity zones and supply/demand flips.
Expert Support in Real-Time
Our technical team is available during market hours to assist with dashboard customization and data interpretation questions. We pride ourselves on human-first technical support.
Master the Market Data Workflow.
Join thousands of analysts using DragonDash for their daily market analytics and strategic planning. Start your visualization journey today.